START A CONVERSATION
Contact us today.
Our global experts are ready to help your business. Get in touch with one of our representatives today.
Send messageThe latest figures indicate an improved employment landscape. The United States experienced a 0.5 percent drop in unemployment rate over the year, moving from 4.9 percent unemployment in 2016 to 4.4 percent in 2017. From a regional perspective, only the Midwest saw a significant difference in employment when compared with the nation. Its 4.1 percent unemployment rate was 0.3 percentage points lower than the national average.
On a state level, 46 states and the District of Columbia also saw a decrease in unemployment rate, with only 5 states remaining unchanged or seeing a slight increase. Alabama had the largest decline in unemployment rate, dropping 1.5 percentage points to 4.4 percent unemployment, followed by Wyoming’s 1.1 percent drop in unemployment resulting in a 4.2 percent unemployment rate. The lowest unemployment rate, however, was held by Hawaii at 2.4 percent, a full two percentage points lower than the national average.
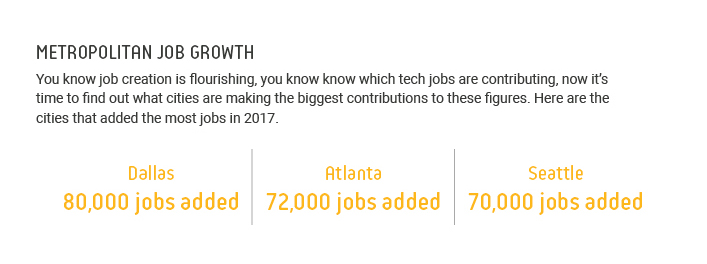
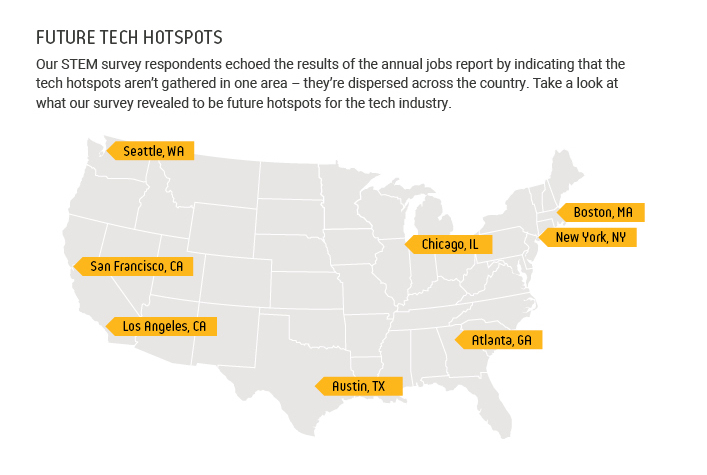
Job growth was rampant in 2017. Forty-five states and the District of Columbia added jobs to their economies. Of those, 30 states added 10,000 new jobs or more. The most jobs were created in California (344,000), Florida (308,000) and Texas (259,000), indicating that job creation wasn’t isolated to only one area of the country.
Tech created nearly half a million jobs in 2017 (444,000), nine percent of which (41,300) were created in engineering. Looking at the total amount of jobs created in 2017 (2,079,000), 21 percent of all jobs created in 2017 were tech jobs. Even better for IT and engineering: this growth is expected to continue – if not accelerate – in the future.
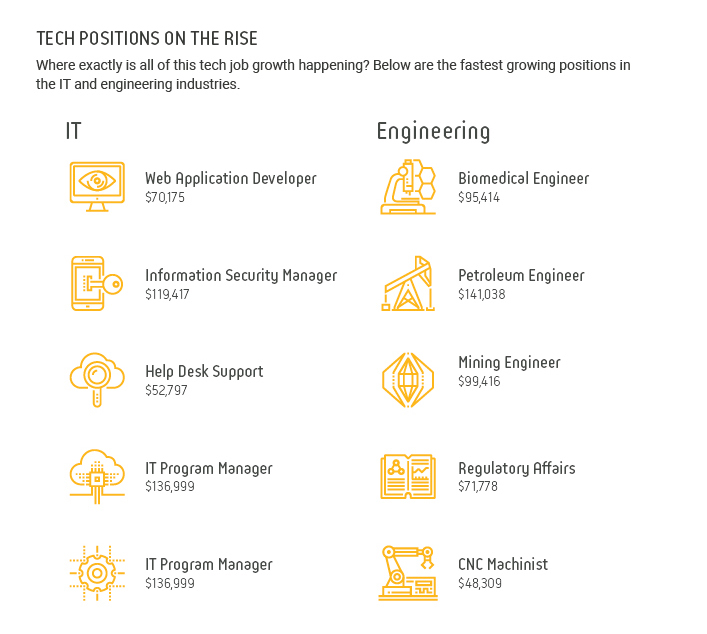
The BLS estimates that between 2016 and 2026, a total of 11.5 million new jobs will be created. This 7.4 percent job growth outpaces previous projections. Digging deeper into these figures, engineering jobs are anticipated to grow at a similar pace as the national average at 7.5 percent for a total of 179,800 new jobs created by 2026. IT jobs, on the other hand, will increase at almost double this pace; they’re expected to grow by 13.1 percent, adding 557,100 jobs to the economy.
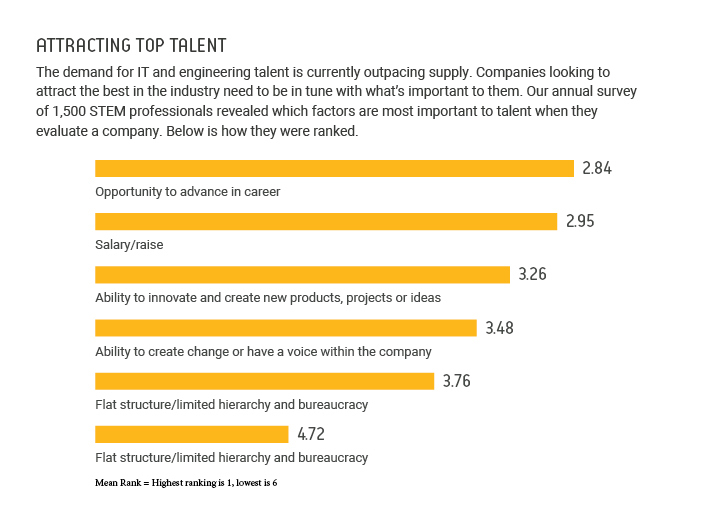
As you think toward the future of the tech employment landscape, it’s important to implement necessary changes to continue to attract top talent. Demand for quality candidates is quickly outpacing supply. Take the first step in partnering with industry experts who will help you make smarter connections.
Sources
https://www.bls.gov/emp/ep_table_102.htm
https://www.bls.gov/news.release/ecopro.nr0.htm
https://www.bls.gov/news.release/metro.nr0.htm